The Illusion of Size: A Monte Carlo Risk Analysis of Aegean Airlines vs. IAG
In our days, there is a firm and unfair situation in geopolitical evolution globally, which can increase the risk of everyday life. The resources of oil and gas are now limited and, if someone considers it, there are many and multiple impacts that you have to face, whether you are a Small Medium Entrepreneur, an individual, or a colossus in your sector like, for example, Amazon, airlines, etc. Every day we face many new subjects in retail and the transportation of goods globally.

So, I used this as a starting point to create a story based on 2 big businesses which functioned in a common sector. In our days, there is a lot of controversy about the way we treat the Stock Market (Χρηματιστήριο) or the way it treats us. The majority of times, people (citizens, customers) forget that by holding a stock, they acquire ownership in the specific company, even if the volume or share is so tiny, like the impact that can be created in London by a flying bee. The stocks are produced for specific reasons, like enhancing the capital volume of a company and the maximization of the company's productivity. There are no specific limits that a company has to reach in reference to the quantity of the stocks it holds. These are issues related to their capacity and the effort that can be created for investors, whether they are large-scale companies which can acquire from 1-20%, or individuals who claim 0.00000001 of the company.
It's important to understand that the stock market works differently than regular retail markets. Stocks represent actual ownership in a company. Sometimes, a company's leadership will decide to execute a stock split, turning one existing share into multiple new ones. They don't do this to magically increase the company's profits or its total value. Instead, they do it to lower the price per share, making it much more affordable for everyday retail investors to buy in.
Having thought about all these issues, I decided to proceed with 2 independent, among them and not correlated, companies. The companies which I chose are BA and Aegean Airlines. My internal "why" can be found in my personal love and respect for these 2 companies. These companies can make dreams come true, travel people, create memories, and be a crucial part of retail. So, because "behind great value, there are efficient employees, brightened leaders, and for sure, people who trust them." That's a cycle, like the complicated cycle of money!
I tried to estimate a range of prices for the stocks. My methodology included computational power given by Python and Google Colab, and the data downloaded from Yahoo Finance. As a professional, I like to maximize the effort of any tech tool, so I started to connect the SQL database with Python using the sqlite3 library, and I used the data from Yahoo Finance. In my first steps, I used to utilize datasets by downloading files in CSV format, which sourced from Yahoo Finance and maybe Google Finance. As anyone can understand, this required multiple times and split tools, and was less flexible. It was less flexible to use because every time you had to create a new db on CSV, but in Python—and specifically on an online tool like Google Colab—the only thing you have to do is to change the "start_date" and "end_date".
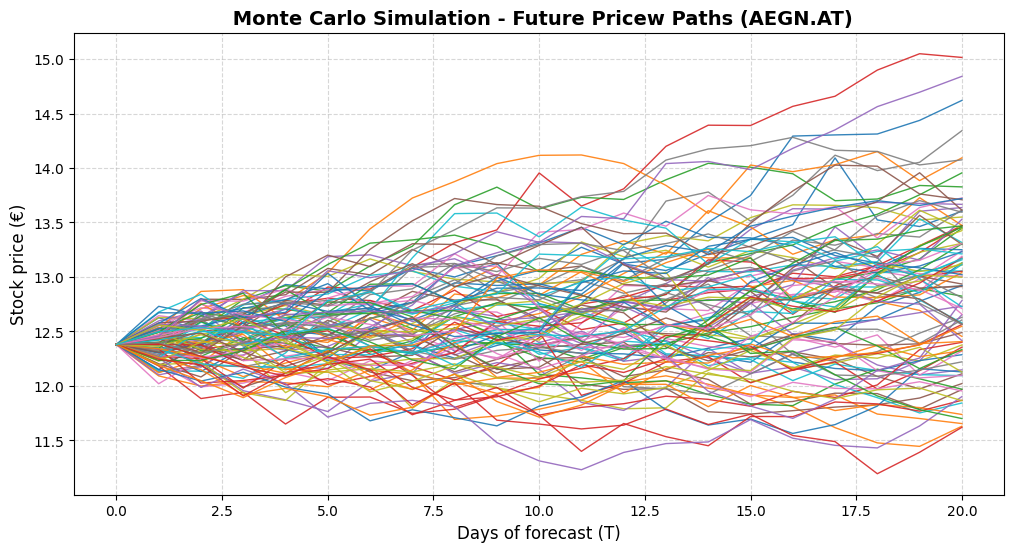
So, after downloading the db and saving it in SQL, I achieved to calculate the VaR and ES for both stocks using 10,000 independent price paths over a 21-day trading horizon.
The structural predictive results of the simulation are presented below:
1st Aegean Airlines (Base Price: €11.24)
- 95% Value at Risk (VaR Floor): -10.40% (Target Price: ~€10.07) There is a 5% statistical probability that near-term market turbulence will break through our structural safety floor, losing at least -10.40% of its value within the 21-day horizon.
- 95% Expected Shortfall (ES Tail-Risk): -13.15% (Target Price: ~€9.76) If market conditions breach the VaR floor and cross into that worst-case 5% tail, -13.15% is the mean expected loss we face.
- 95% Upside Potential (Ceiling): +12.80% (Target Price: ~€12.68) On the flip side, there is the exact same 5% probability of a powerful bullish breakout driving the asset past a structural resistance ceiling of +12.80%.
- 95% Expected Potential (Extreme Outperformance): +15.90% (Target Price: ~€13.03) If the market catches strong momentum and enters the positive 5% tail, the stock runs hard enough to hit an average expected return of +15.90%.
2nd British Airways / IAG (Base Price: 420 GBX)
- 95% Value at Risk (VaR Floor): -17.74% (Target Price: 345 GBX) There is a 5% statistical probability that near-term market volatility will break through our support floor, losing at least -17.74% of its value within 21 days.
- 95% Expected Shortfall (ES Tail-Risk): -21.90% (Target Price: 328 GBX) If the asset crosses into that worst-case 5% tail-risk zone of the distribution, -21.90% is the mean expected loss we face.
- 95% Upside Potential (Ceiling): +22.35% (Target Price: 514 GBX) There is the exact same 5% probability of a powerful bullish breakout driving the asset past a structural resistance ceiling of +22.35%.
- 95% Expected Potential (Extreme Outperformance): +28.66% (Target Price: 540 GBX) If the market catches fire and enters the positive 5% tail, the stock runs aggressively, hitting an impressive average expected return of +28.66%.
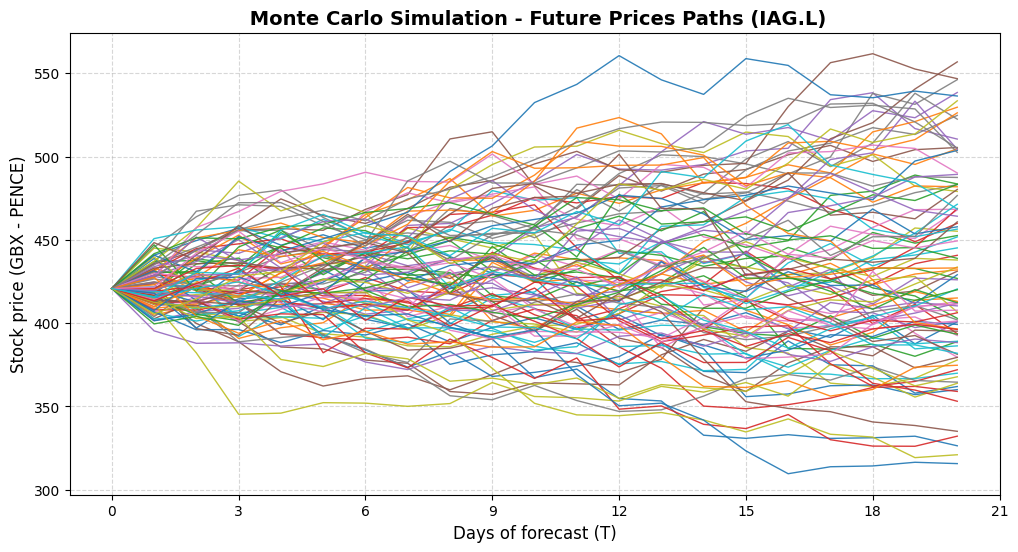
Intuition says a giant like IAG is safer than a regional force like Aegean, but the data disagrees. Diving into the distribution tails, we see Aegean maintaining a strictly symmetric and controlled risk profile. Conversely, IAG operates with explosive asymmetry, where the potential gain (+28.66%) crushes the statistical risk (-21.90%). This proves that massive market capitalization does not guarantee stability, but rather creates tools for those who know how to read probabilities. To survive the market, we must leave emotion behind and trust the computational truth of Monte Carlo simulations. Ultimately, risk is not something to be feared, but something we measure, model, and exploit.